


Overview
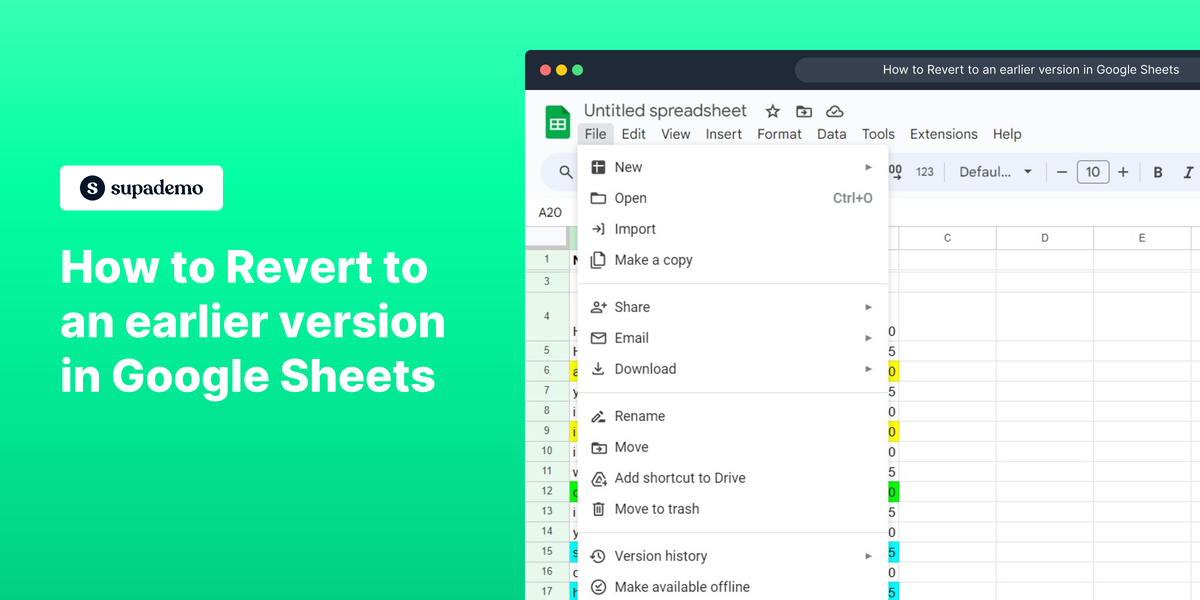
Simplify your Google Sheets experience with a guide on reverting to earlier versions effortlessly. Enhance workflow efficiency by understanding the seamless process of rolling back changes, ensuring clarity and precision in your data management within the Google Sheets platform. Streamline your tasks with this comprehensive guide, empowering you to navigate through version history for optimal control and data accuracy.
Who is Google Sheets best suited for?
Google Sheets is best suited for a wide range of professionals, including Financial Analysts, Project Managers, and Data Scientists. For example, Financial Analysts can use Google Sheets for creating budgets and financial reports, Project Managers can leverage it for tracking project milestones and tasks, and Data Scientists can use it for organizing and analyzing large datasets, all benefiting from Google Sheets’ collaborative features and powerful data processing capabilities.
How to revert to an earlier version in Google Sheets
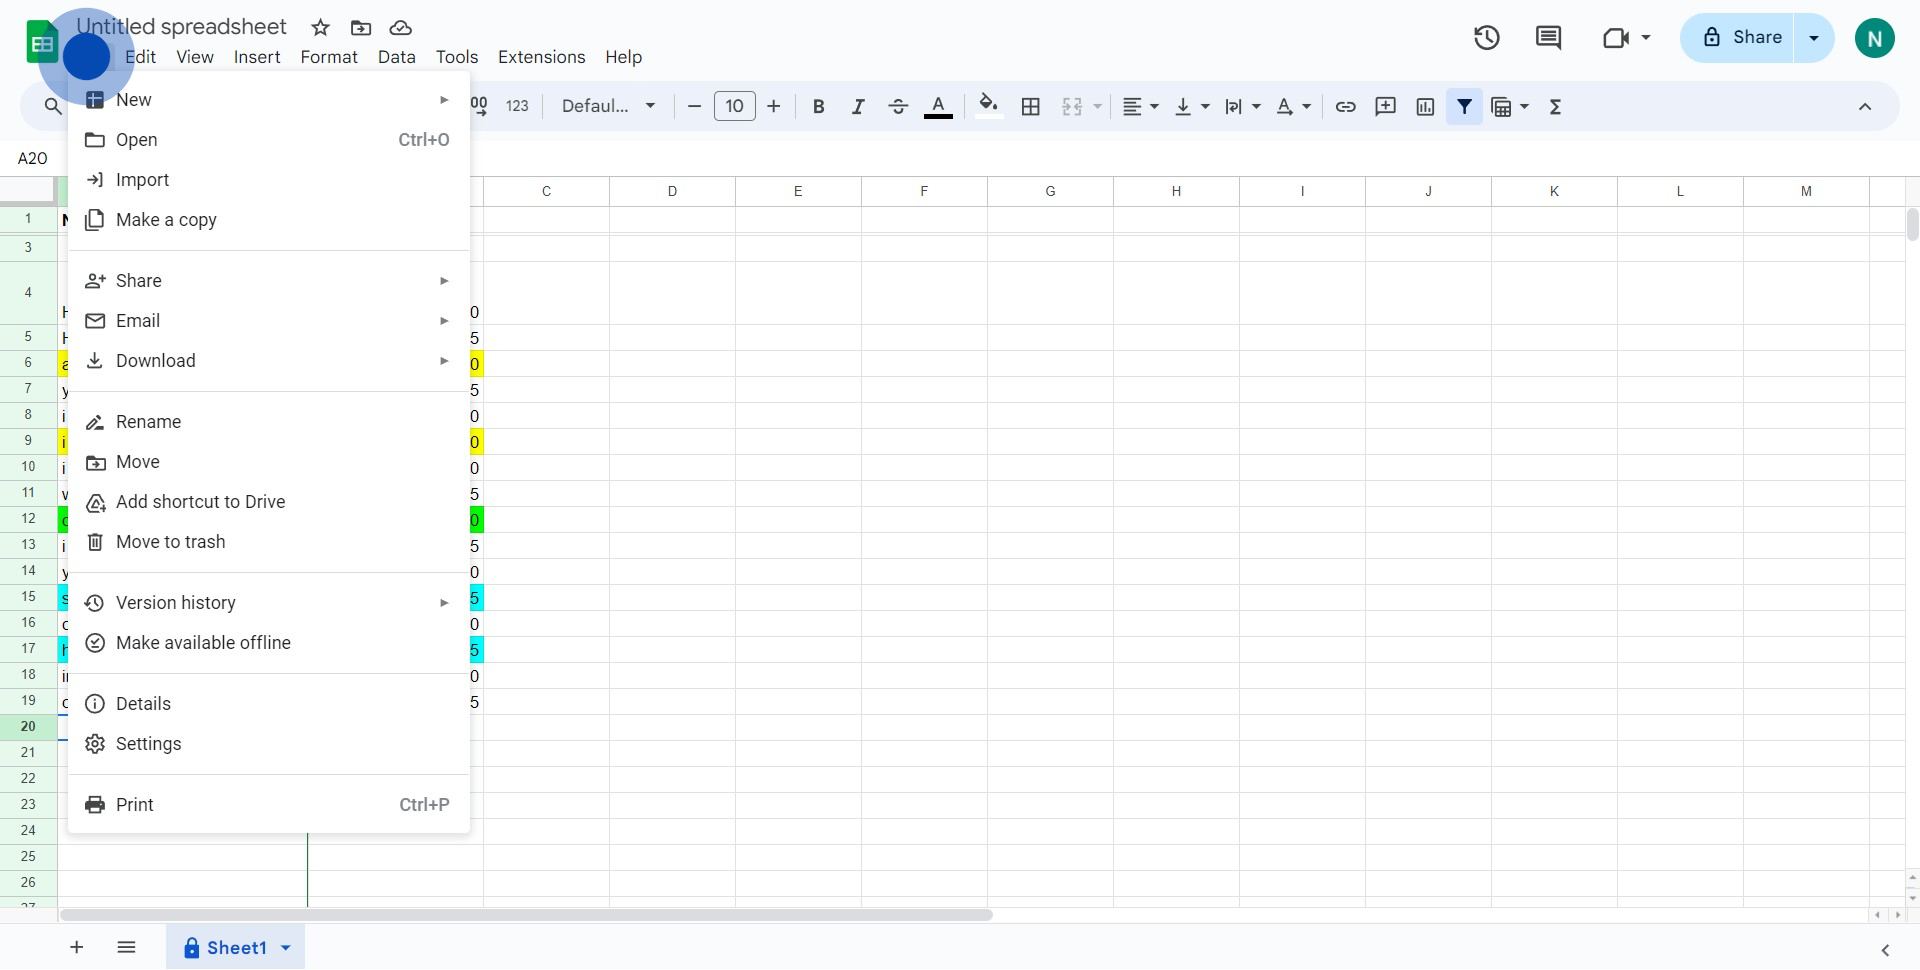
1. Start by selecting the 'File' menu.
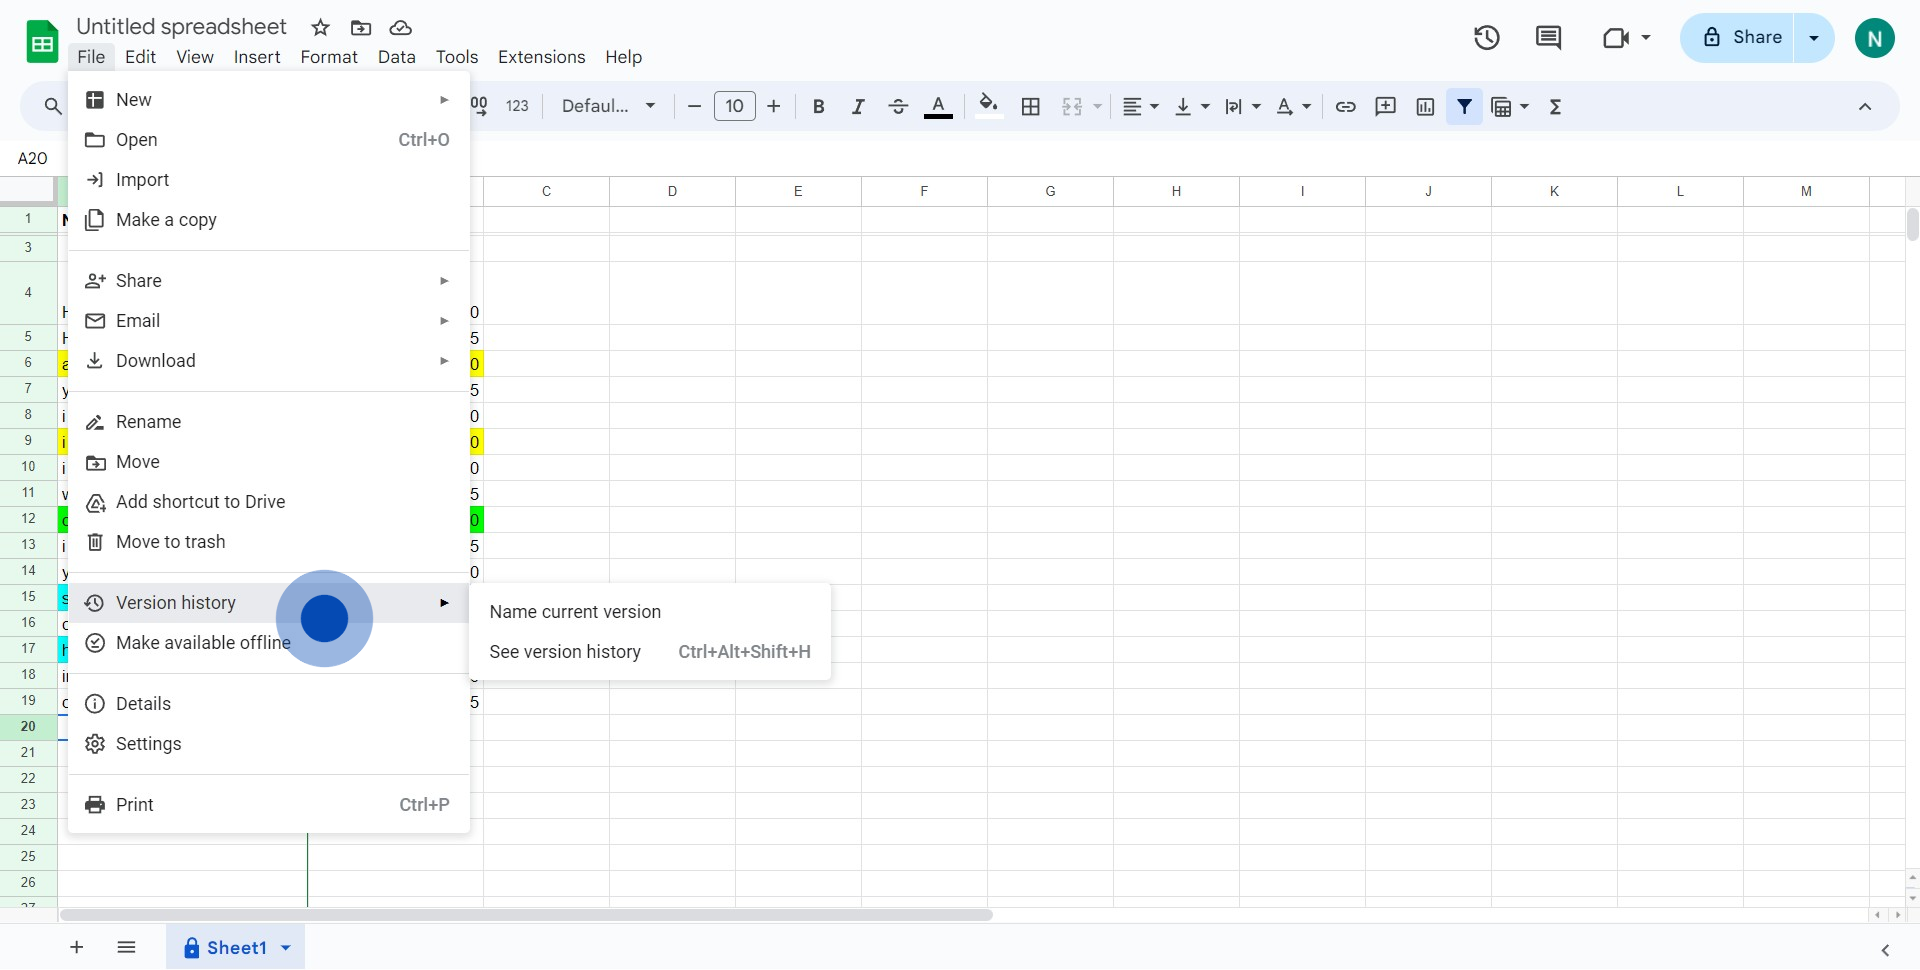
2. Then, choose the 'Version history' option from the dropdown.
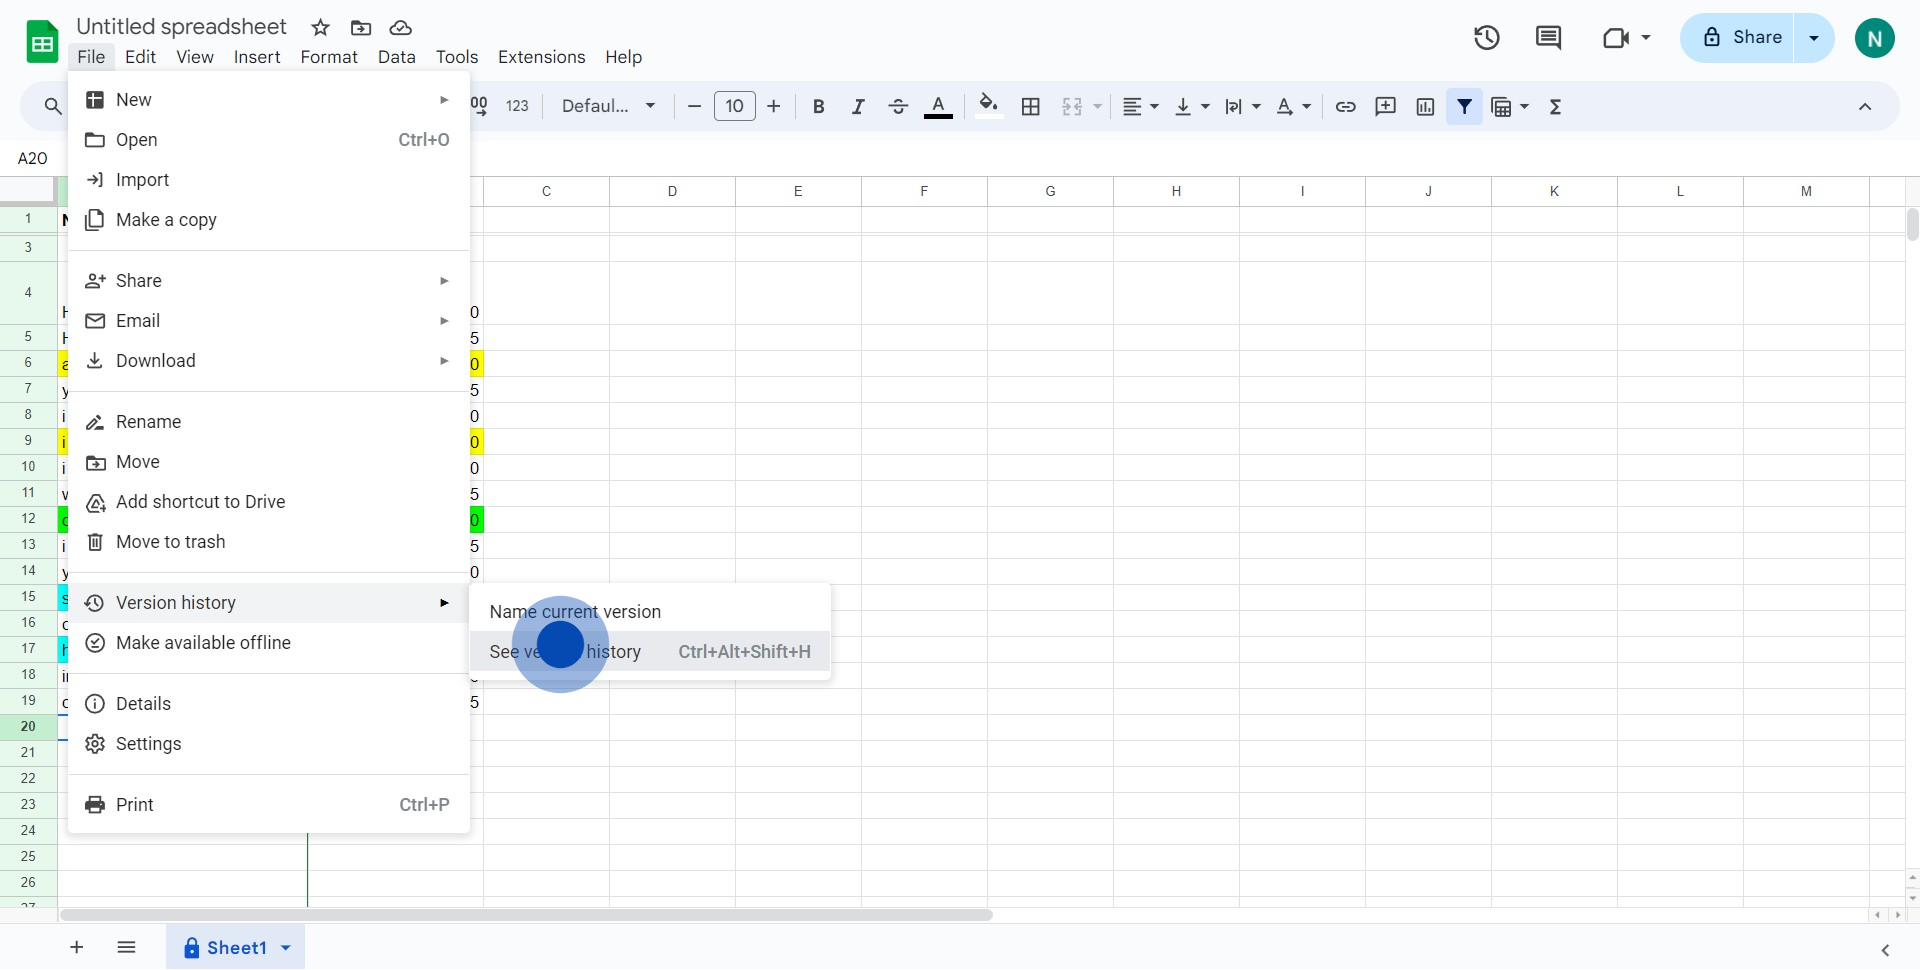
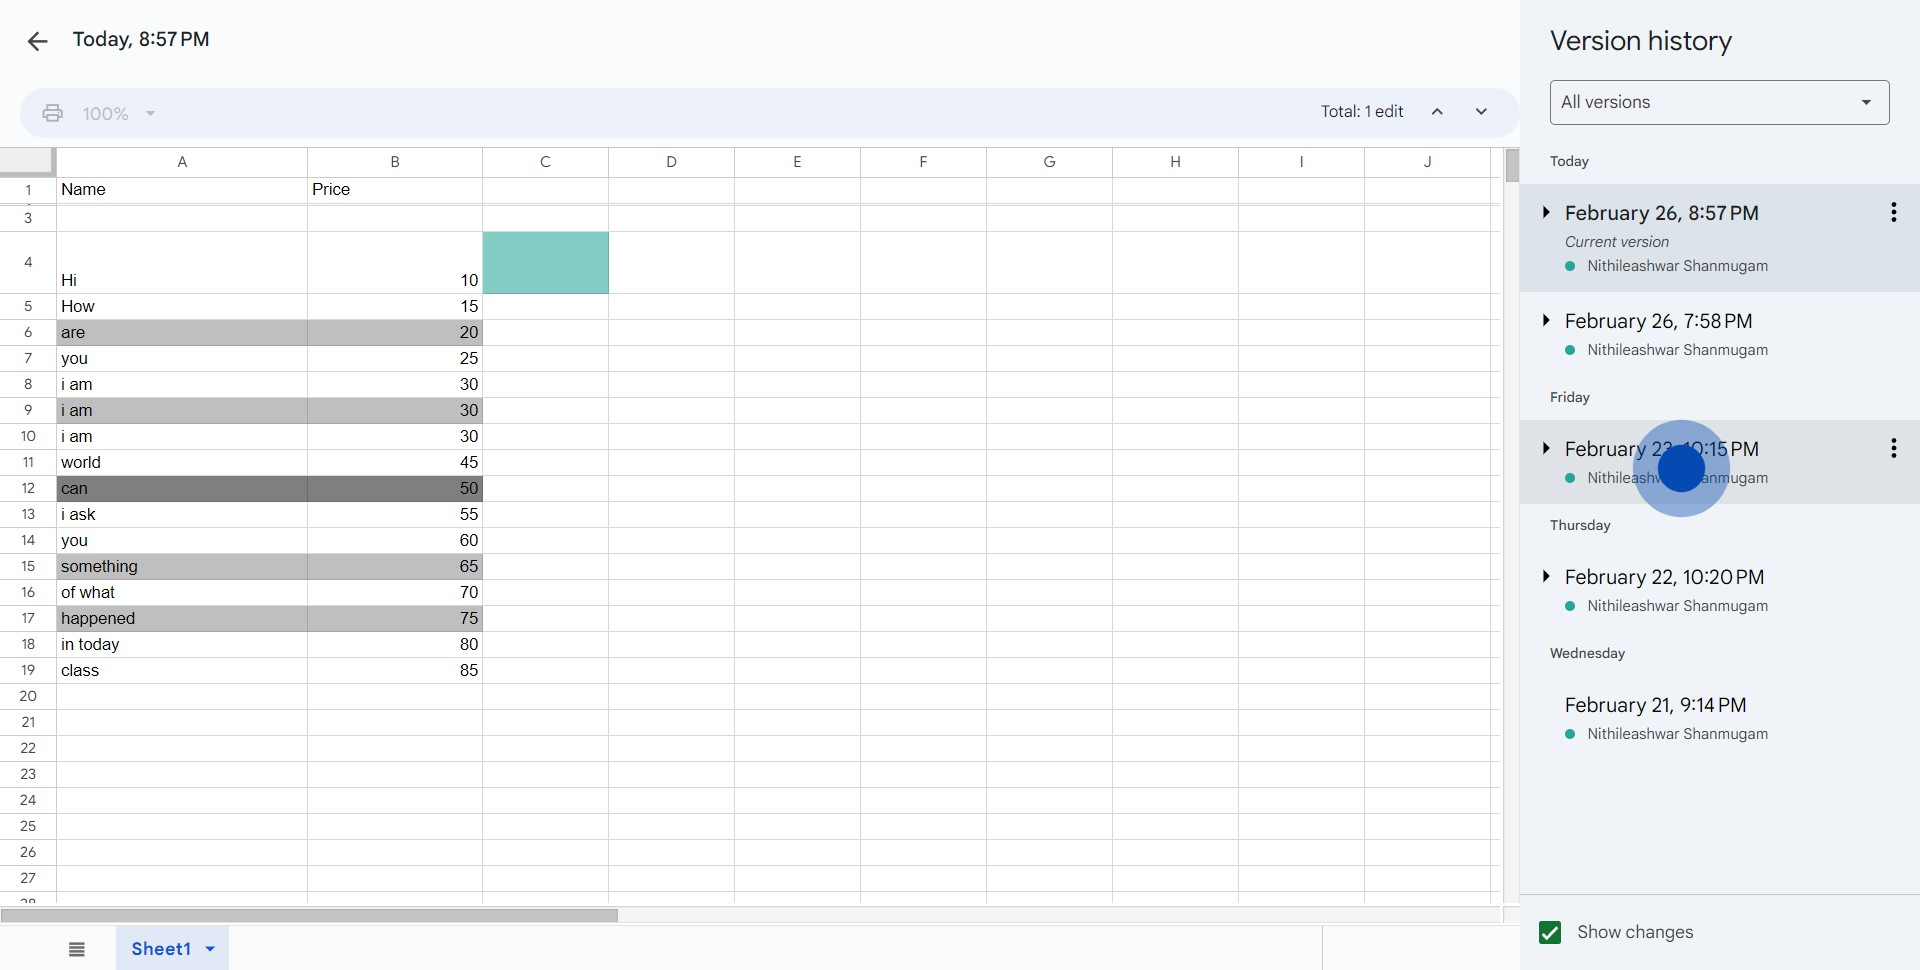
3. Click on the 'See version history' option next.
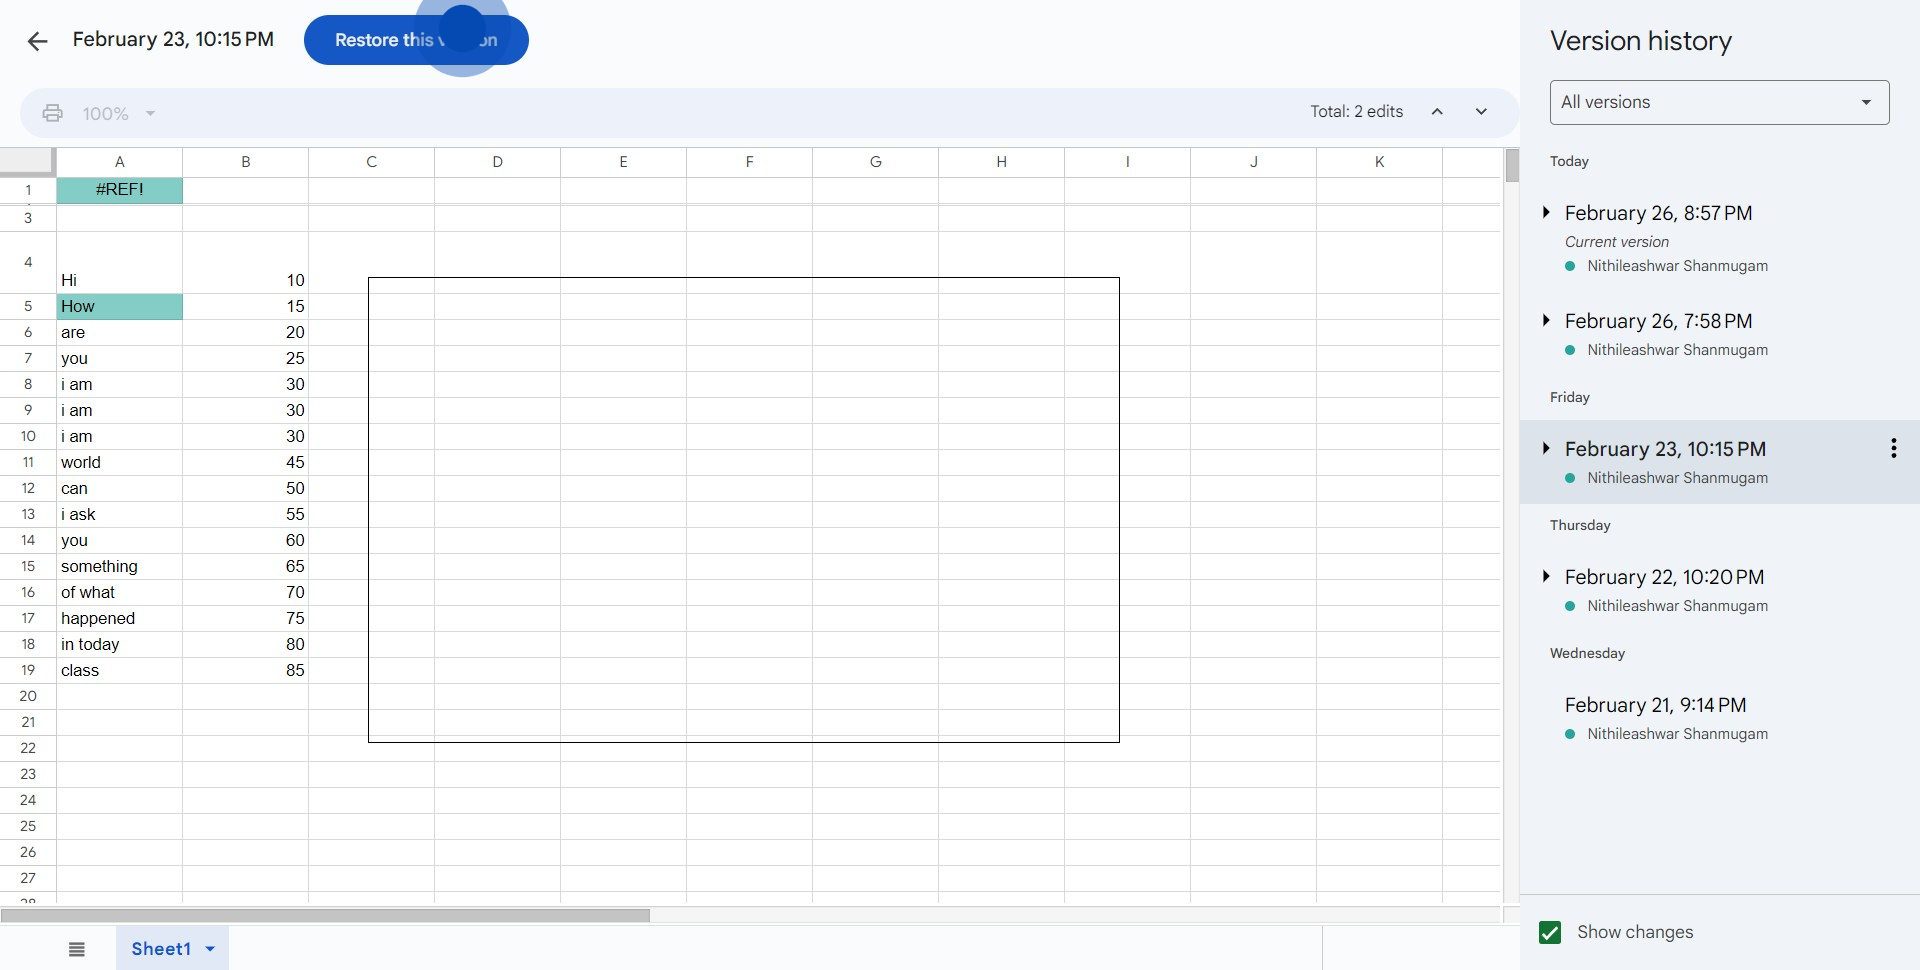
4. Find the option you want and click on it.
5. Proceed by choosing the 'Restore this version' command.
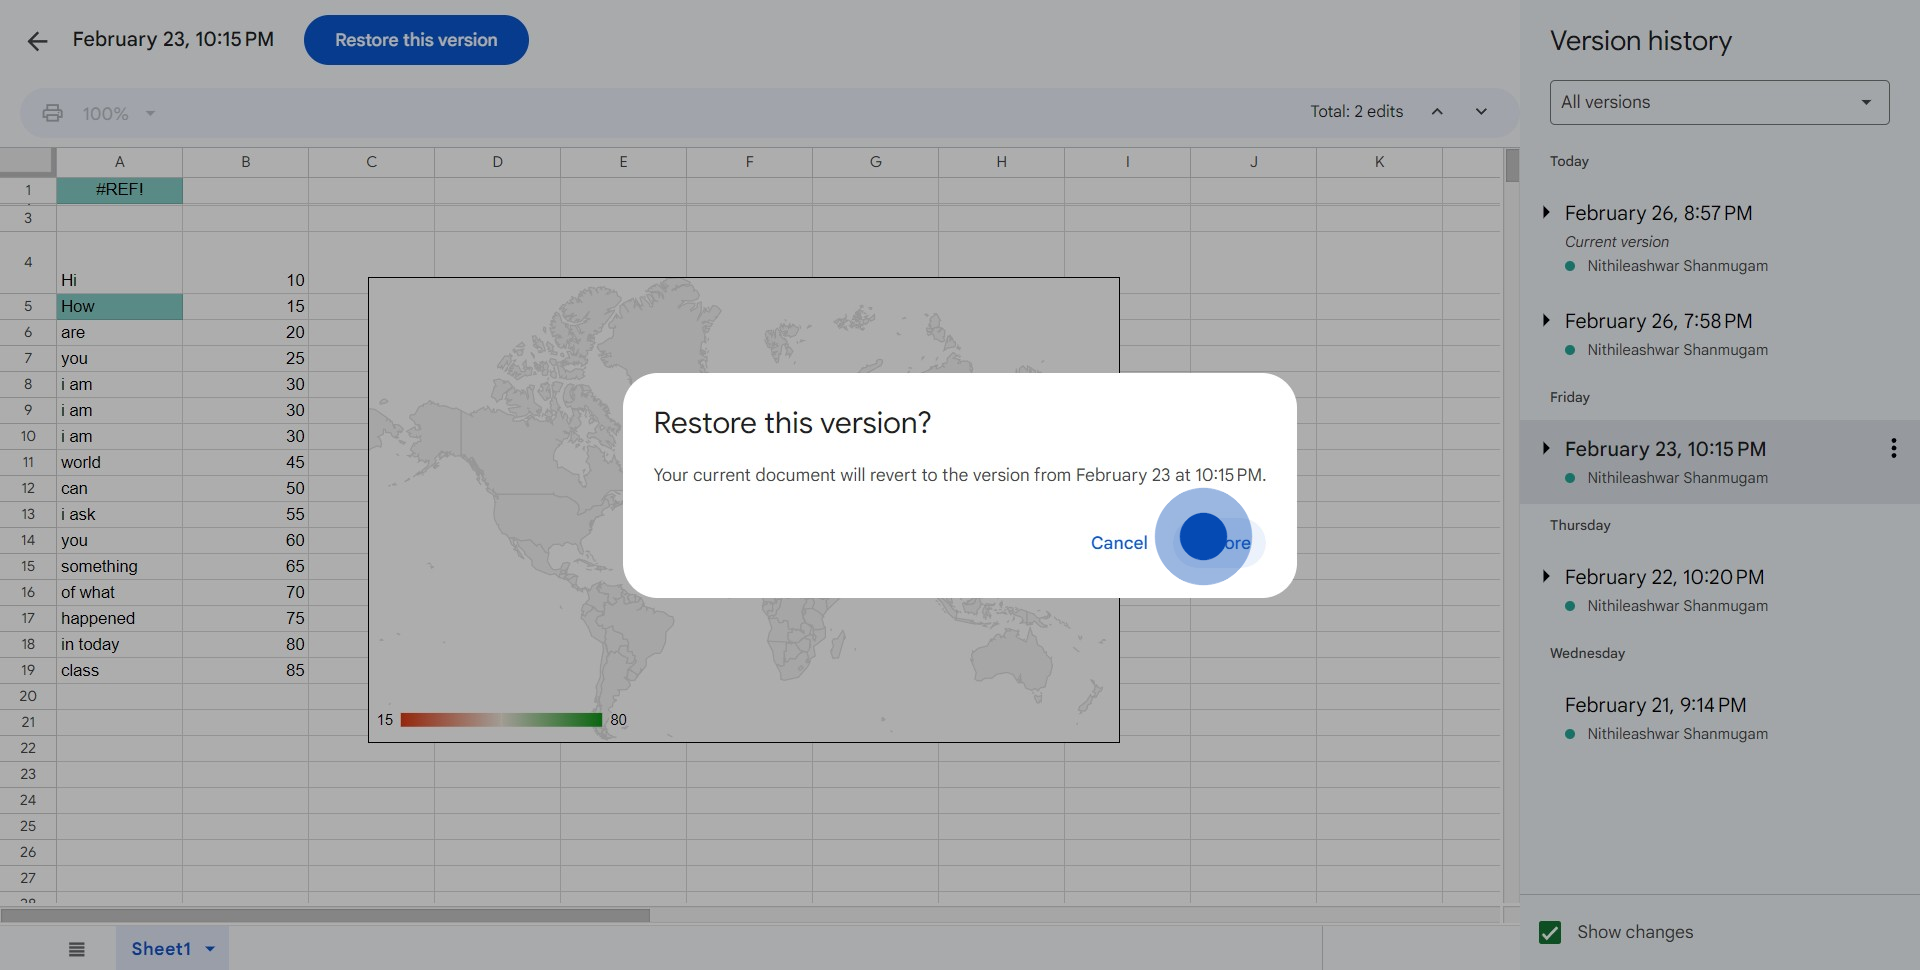
6. Confirm your action by selecting 'Restore'.
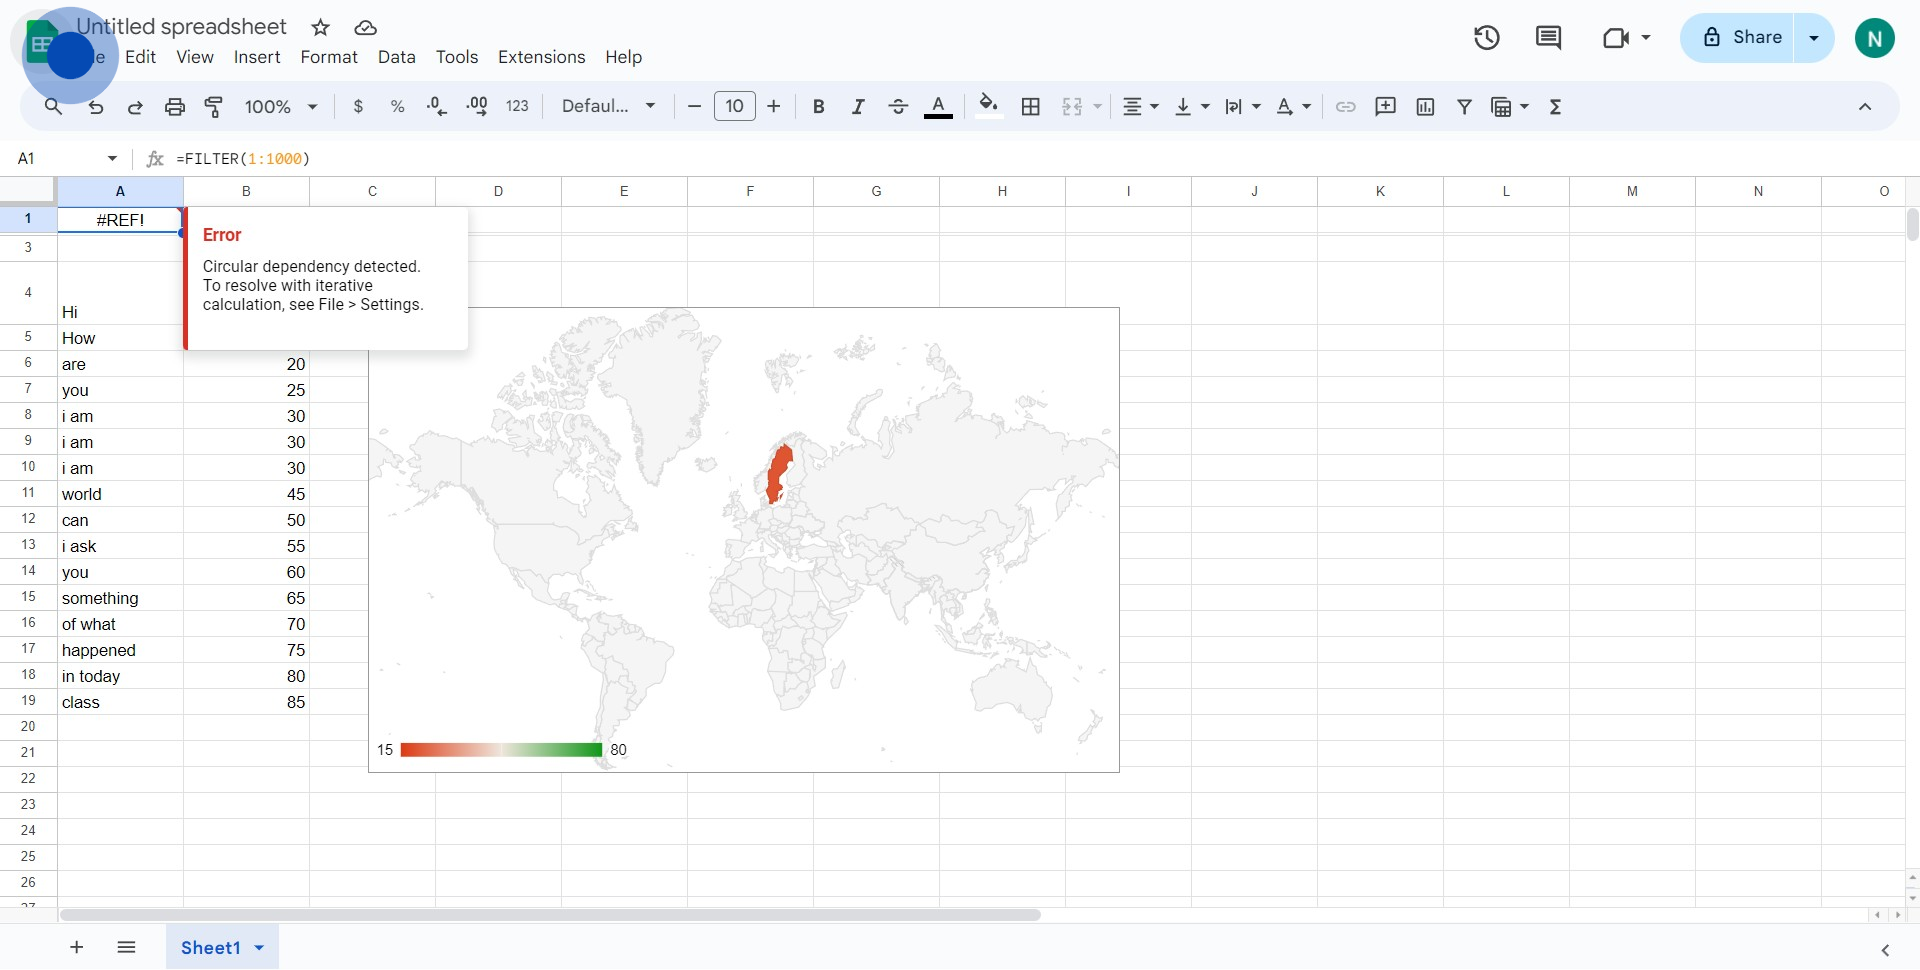
7. Congratulations, you have successfully restored to an earlier version of the document.
Common FAQs on Google Sheets
How do I use pivot tables in Google Sheets?
To use pivot tables in Google Sheets, select the data range you want to analyze. Click on “Data” in the top menu and choose “Pivot table.” A new sheet will be created with the Pivot table editor on the right. You can drag fields into the Rows, Columns, Values, and Filters sections to organize and summarize your data. This allows you to quickly calculate sums, averages, counts, and other statistics to gain insights from your data.
How can I create a chart or graph in Google Sheets?
To create a chart or graph, select the data you want to visualize. Click on “Insert” in the top menu and choose “Chart.” The Chart Editor will appear on the right, and Google Sheets will automatically generate a default chart based on your data. You can customize the chart type, such as bar, line, or pie, and adjust settings like axis titles, colors, and labels in the Chart Editor to better represent your data.
How do I use the IMPORTRANGE function to import data from another Google Sheet?
The IMPORTRANGE function allows you to import data from another Google Sheet. To use it, type =IMPORTRANGE("spreadsheet_url", "range_string") into a cell. Replace spreadsheet_url with the URL of the Google Sheet you want to import data from, and range_string with the specific range of cells you want to import (e.g., "Sheet1!A1"). The first time you use this function, you’ll need to grant permission for the sheets to access each other by clicking “Allow access” when prompted.
Create your own step-by-step demo
Scale up your training and product adoption with beautiful AI-powered interactive demos and guides. Create your first Supademo in seconds for free.
